Foundations of Inference
Lecture 7
NC State University
ST 511 - Fall 2024
2024-09-11
Checklist
– Keep up with Slack
– HW-2 released Monday (9-16)
– Quiz 3 released this Wednesday (5:00pm ish)
Announcements
Quiz 2 question 10 was designed for you to think about the color pallet
I’m getting a wide variety of responses, including answers that are correct but not about the color pallet (e.g., axes labels)
No grades are final until the rubric is posted on our website
I’ll make an announcement on Slack.
Last class
At a high level
– We introduced the idea of random variables
– We calculated probabilities using probability distributions
– Introduced the idea of a sampling distribution
Let’s put the puzzle together
What we showed last time
We did A LOT of work to show what your intuition may already suspect
Making an informed guess
Assume we are interested in the population mean height of NC State students. If you could collect data (say n = 50 students), how could you could you come up with this guess?
Population Distribution
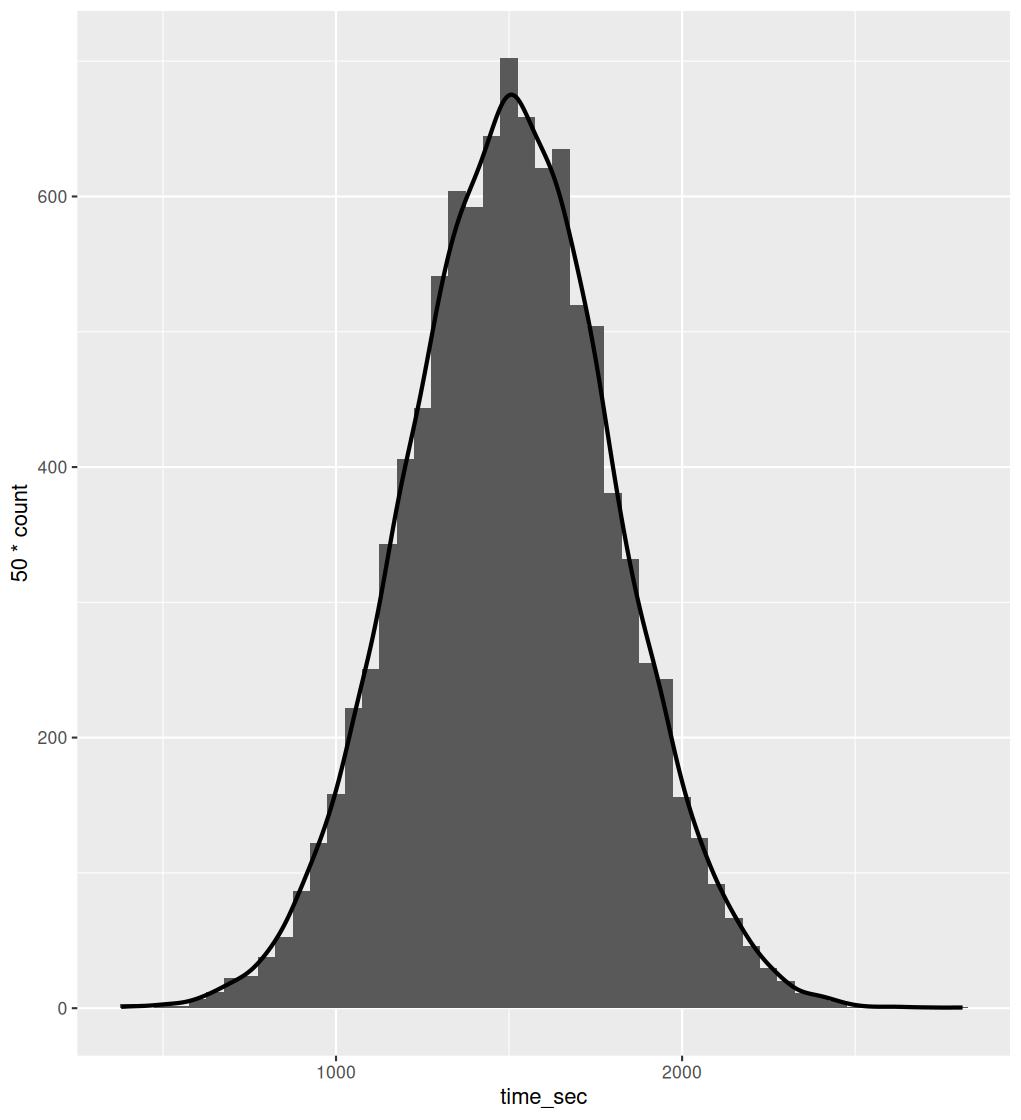
Population distribution of times taken to complete an IQ test
– N(\(\mu\), \(\sigma\))
\(\mu\) - population mean; \(\sigma\) is the population standard deviation
X ~ N(1504, 293)

Sampling Distribution
The concept of a sampling distribution is as follows….
A sampling distribution is a distribution of all of the possible values of a statistic; computed from randomly drawn samples of the same size from a population.
We can conceptualize a sampling distribution by thinking of taking k number of random samples from the population, calculating each mean, and plotting it.
What does this look like
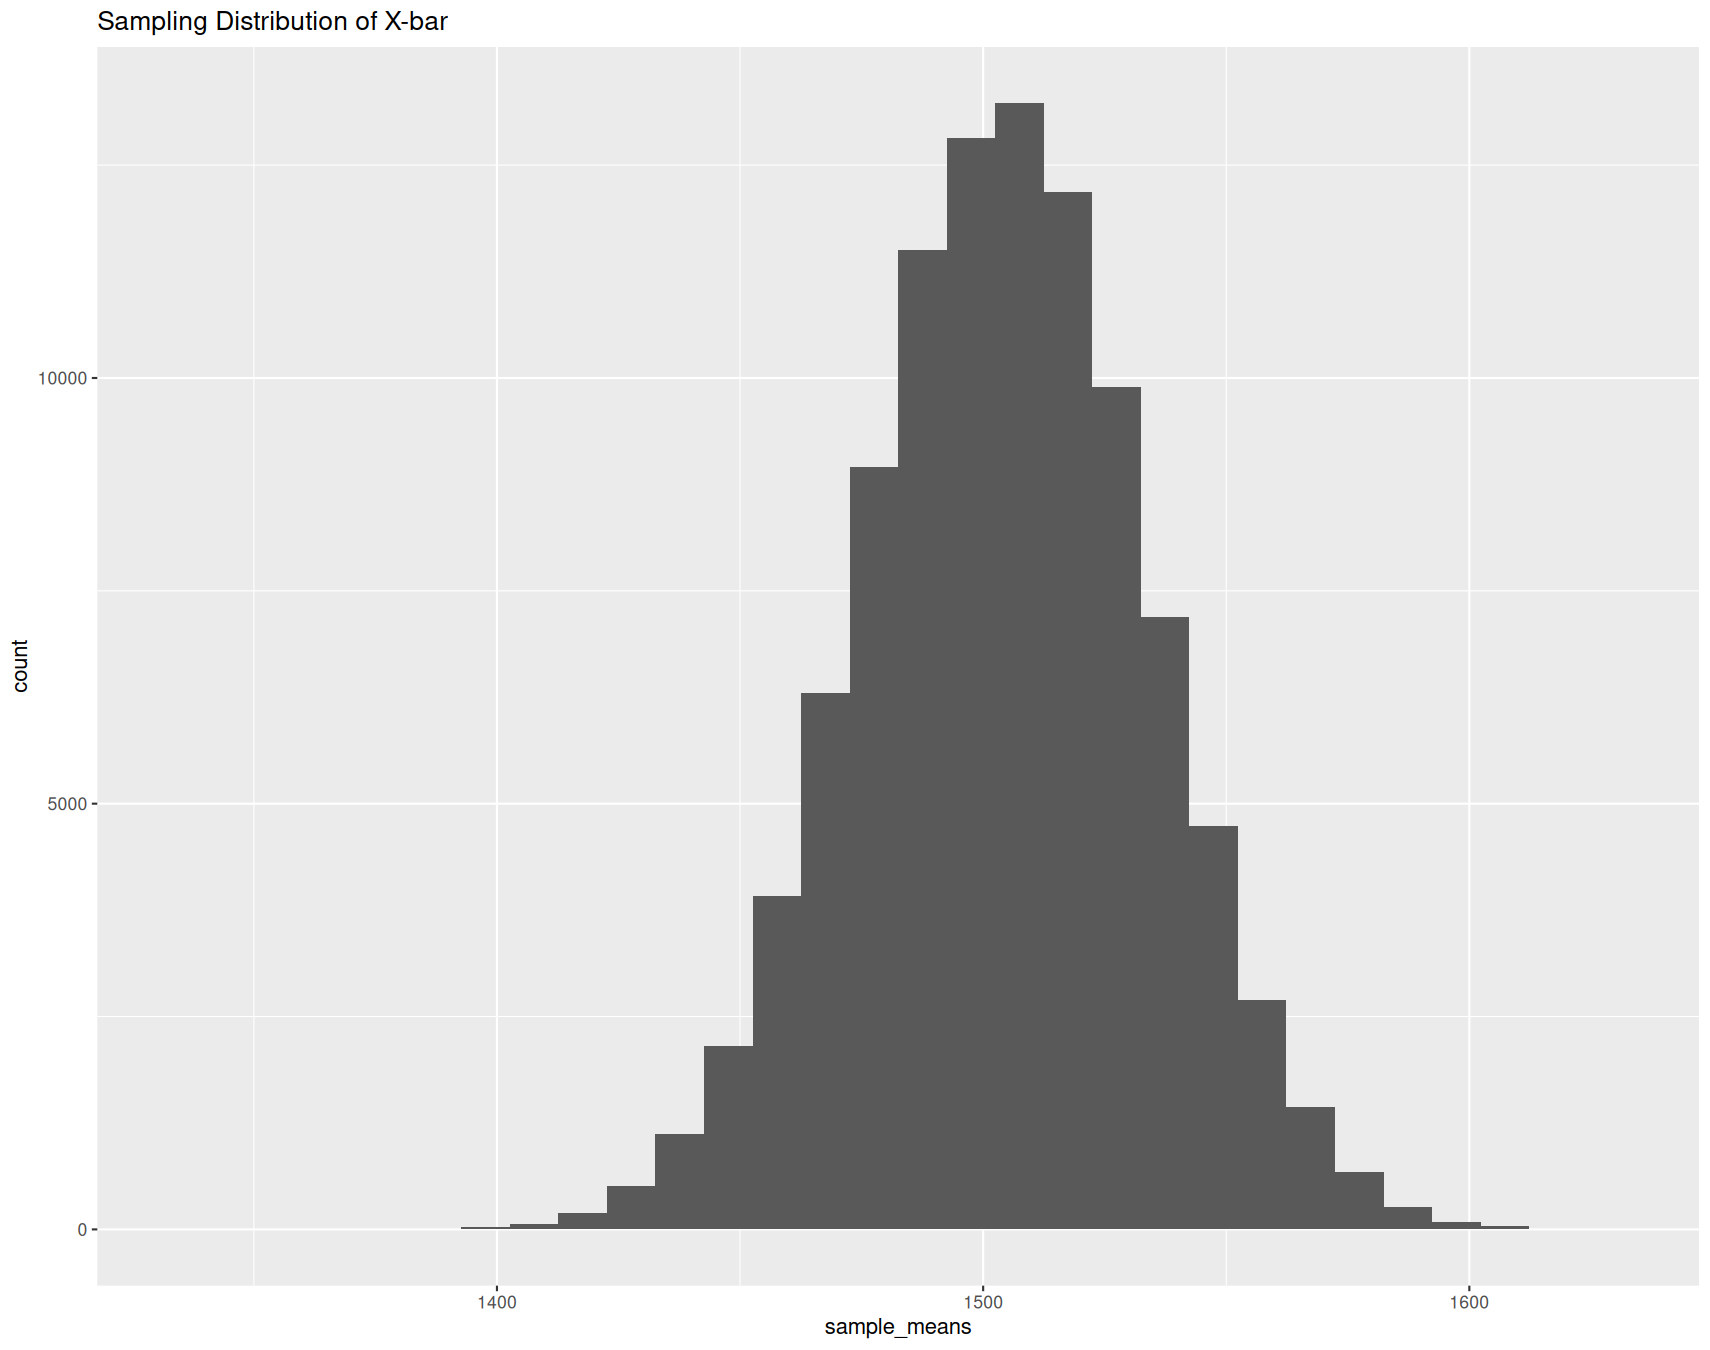
The fundamental idea of what a sampling distribution is can be seen below
Let’s assume that our sample size for our statistic (sample mean) is n = 100.

Sampling Distribution
What do we notice about this graph compared to the population distribution?
– Shape?
– Center?

Sampling Distribution

This is normally distributed, just like the population distribution
The center is the same as the population distribution
What does this tell us
– It tells us that if the population distribution is normal, than the sampling distribution of the mean will be normal
– It tells us that \(E(\bar{x})\) = \(\mu\)
^ This is the math term for saying “the sample mean is our best guess/estimate of the population mean!
Which you may have guessed, but now you know!
Sampling Distributions
The reason why we care about sampling distributions is to quantify variability around our statistic.
The reason why we care about sampling distributions is to quantify variability around our statistic.
Last class example
I am a researcher that is really interested in NC State student’s height. I took a sample of 50 students and calculated my sample mean
\[ \bar{x} = 5ft- 6 inches \]
If you went out and collected data on 50 students, do you think that your sample mean would be the same?
Why this matters
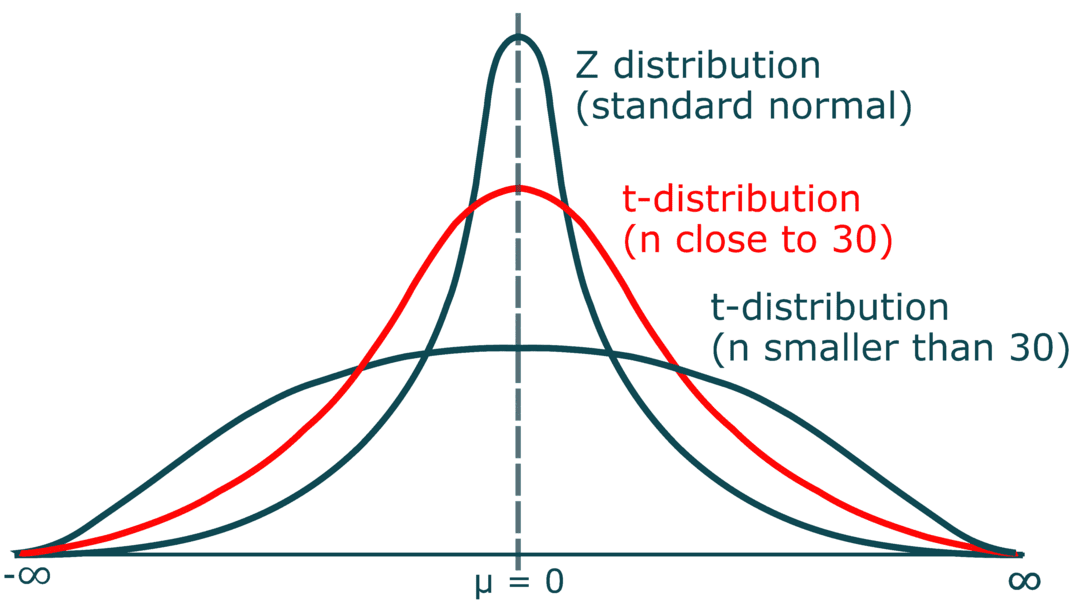
In practice Under the assumption of normality, the sampling distribution of the mean follows a z or t-distribution (which allows us to know the variability around our statistic)
And this understanding allows us to conduct hypothesis tests + create confidence intervals!
t & z distribution

We can use these to understand sampling variability of our statistic (and will!)
So… normality matters. The shape of the distribution matters.
Sampling Distributions
We need to understand is the shape of the sampling distribution
We saw, from last class, that if the population distribution is normal, the sampling distribution is always normal
What if the population distribution isn’t normal?
Central Limit Theorem
– The shape of the sampling distribution of the means, regardless of the population distribution, is approximately normally distributed if….
Central Limit Theorem
Assumption 1:
Observations in the sample are independent. Two rules of thumb to check this:
-   completely random sampling (random sampling with replacement)
-   if sampling without replacement, sample should also be less than 10% of the population size
Central Limit Theorem
Assumption 2:
The sample is large enough. The required size varies in different contexts, but some good rules of thumb are:
-   if the population itself is normal, sample size does not matter.
-   if numerical require, \>30 observations
-   if binary outcome, at least 10 successes and 10 failures.
Let’s show this: sep-11-ae
Terms for Monday (if time)
\(\mu\) - population mean
\(\{bar}\) - sample mean
\(\pi\) - population proportion
\(\hat{p}\) - sample proportion
Hypothesis testing
What is it?
It’s a “test of significance” around an assumption made on a population parameter.
Hypothesis testing
The assumption made is called a null hypothesis
Context: Assume the height researcher is back, and we want to test the following
\(H_o: \mu\) = 6ft
Hypothesis testing
Our research question is called the alternative hypothesis. Do you think students are taller, shorter, or different than 6ft?
\(H_o: \mu\) > 6ft
\(H_o: \mu\) < 6ft
\(H_o: \mu\) \(\ne\) 6ft
